
Modeling the energy use in a building—whether in the design phase or already in the field—has become increasingly important. For building owners, reducing unnecessary energy waste means buildings can be more cost-effective to run; can attract high-paying building occupants; and can be better positioned to earn LEED or other ‘green’ building certifications. However, energy modeling for a building is indeed an art and a science, and any modeling that falls short of truly capturing energy use can impact the building’s cost and overall performance.
Typical energy modeling tools stretch across different software that allows for porting in the digital blueprint of a building, as well as the energy-consuming equipment and machinery. Evaluating the performance of HVAC (i.e., heating, ventilation, and air conditioning) systems is typically the most impactful aspect of energy modeling, though advanced studies will also look at components like lighting, occupant energy use, and sector-specific equipment (e.g., servers in an office building or refrigeration in a grocery store).
Getting the energy modeling right starts with choosing the right platform and associated tools. We recently evaluated our energy models and process using cove.tool compared with another common software tool, TRACE 700. DBR wanted to better understand the accuracy and methodology because of cove.tool’s purported value of achieving actionable results in minutes, rather than hours or days required by TRACE.
What is pEUI and the overall energy breakdown?
Before diving into the specifics of the comparison study, it’s important to understand the baseline of what the tools are attempting to achieve. Specifically, the most robust energy modeling tools will utilize predicted energy use intensity (pEUI), which describes the modeled figure for how much energy is expected to be used per square foot in a building over a given time, such as by kBtu/ square foot / year. Looking at this figure will give a building owner or facilities manager an overall idea of how the building is likely to perform in terms of energy efficiency, which can largely be translated into expected utility costs.
That single figure can be thought of as the critical score or ‘grade’ of building energy performance, but to dig into the performance further requires the overall energy breakdown. This breakdown can be thought of as the scorecard or synopsis that explains how the pEUI was reached, as it will evaluate the energy use by various major systems and equipment types throughout the building. This overall energy breakdown is helpful because it can pinpoint if the major energy use was coming via heating and cooling, via appliances, or from some other component. Based on these more granular aspects, a building manager can compare their building’s performance to similarly sized buildings to see if they are over or under performing, while also identifying where the low-hanging fruit can be for energy improvements and efficiency upgrades.
Understanding how cove.tool evaluated energy performance compared with TRACE 700 requires evaluation of both the pEUI and the overall energy breakdown to get the full picture.
Energy modeling comparison of cove.tool and TRACE 700 using different methods
DBR recently completed a study comparing the difference between pEUI and overall energy breakdown, seeking to learn how the overall energy breakdown varied between cove.tool and the TRACE 700 methodology.
To get a comprehensive evaluation, this comparison was done for two different methods offered by cove.tool: Revit import method and inputting the geometry numerically. By tackling both methods and comparing the results, we were able to identify if any discrepancies found were due to the method or from the difference in software tools. The comparison concluded that regardless of the input methodology, the differences found were the same.
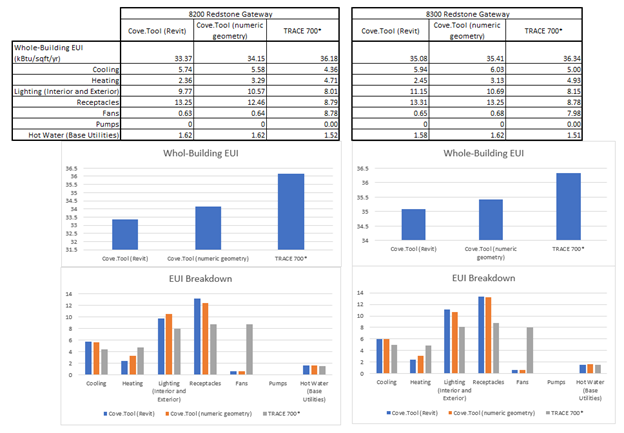
The pEUI evaluated was similar between cove.tool and TRACE 700, but the notable variance came when looking at the overall energy breakdown. Specifically, we noted that the energy usage assigned to the interior fans, the receptacles, and the lighting saw significant differences between the two tools:
DBR seeks to get the most accurate and consistent results from energy modeling, so we wanted to identify the root cause of these differences. cove.tool evaluated these differences, finding the following:
Explanation of Power Fan Settings
When digging into the data, they found that the Specific Fan Power setting used for cove.tool projects (both Revit and numeric geometry) was set as ‘Local Ventilation.’ Using this setting represents the lowest fan power input and tends to be applicable to small systems, or even systems that don’t have ducts incorporated into the building whatsoever. However, the building DBR was modeling uses RTU with series fan power VAV terminals and heat recovery. For the cove.tool modeling, these systems are best represented by the input of ‘Central Mechanical Ventilation Including Heating, Cooling and Heat Recovery,’ as noted in their input FAQ.
Generally speaking, the specific fan power (SFP) setting represents how much power is required to move air with a given fan system, and high SFP vs. low SFP will influence the energy use of the fans and the overall results. For others looking to use cove.tool power fan settings, what’s important to remember is the meaning behind the specific settings:
- Central Mechanical Ventilation Including Heating, Cooling, and Heat Recovery: A full air handling system with all possible components in the main unit. Fully ducted to all spaces within the building
- Central Mechanical Ventilation with Heating and Cooling: A full air handling system with many components in the main unit, without a heat recovery device. Fully ducted to all spaces within the building
- Local Ventilation (e.g., Window/Wall/Roof Units): Limited components within the central system, typically just heating and cooling and limited ductwork to spaces within the building
- Other Local Units (Fan Coil Units): Fan Coil Unit local to each space with limited ductwork distribution
These different fan settings represent the type of customization and personalized tailoring that the cove.tool software offers, rather than painting any energy modeling project with a broad brush, allowing it to get the most accurate results possible with the easiest and most straightforward interface and input process possible. These types of features are what set cove.tool apart from other tools on the market.
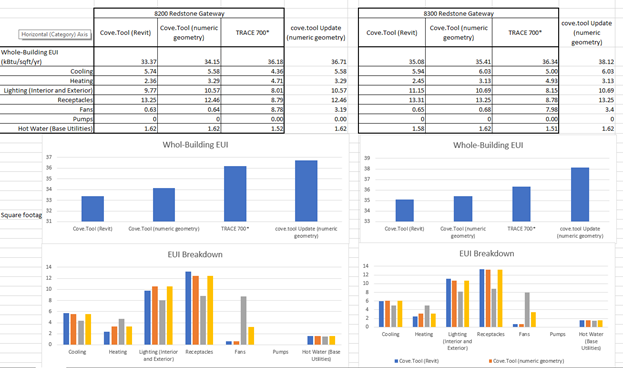
When the cove.tool team assisted DBR in updating our models according to these settings, the results showed great alignment with TRACE 700:
What is the ISO 13790 method for calculating annual energy performance?
Another important consideration that cove.tool was able to share with us based on this comparison exercise was the modeling methodology cove.tool uses in line with the ISO 13790 method for calculating annual energy performance.
Modeling in accordance with ISO 13790 does not explicitly calculate the amount of airflow used for cooling or heating in a given building. Instead, this type of modeling evaluates the total energy used for those purposes and applies ‘use factors’ based on the specific characteristics of each system. In this way, the fan power reported by the ISO model is that associated directly with the outdoor air only, which in the DBR’s case resulted in less energy use than the total TRACE reports because TRACE is more explicitly separating out all fan energy (that associated with outdoor air and cooling air) into a single bucket.
Conclusion
In the end, this comparison study highlighted how close the pEUI numbers were and underscored the differences in methodology and the importance of true and accurate inputs to any sort of modeling process. What really sets cove.tool apart is it achieved the accurate pEUI number in agreement with TRACE 700, and it did so in mere minutes, rather than the hours or days that the other platforms often require. By getting accurate results to design teams quickly, they can be used right away without spending the limited resources of project teams and saving on project costs and resources.